Baseline periods are used as a reference to evaluate future climate conditions. You might remember reading something like: “average air temperature is projected to be 1.5°C higher in 2040 compared to the 1961 to 1990 average”. Then 1961 to 1990 is the reference or baseline period to which the future climate is compared to. While global changes in mean temperature are very robust to the choice of baselines, it turns out that the choice of the baseline period can affect key messages and policy recommendations drawn for regional studies that track a highly dynamic variable such as river discharge. In such cases, researchers should be careful when choosing a baseline.
Let us try to explain why.
In one project we simulated river discharge in the Volta River basin in West Africa using a 30-year baseline period (1961-1990) to assess future changes in discharge. Later, we assessed those same simulations for different stakeholders based on a 20-year baseline period (1986-2005). The difference between the results was striking. The projected changes in river discharge showed large differences. Sometimes trends were even opposing. How could this happen?
Defining a baseline period
First, we need to explain how we define a baseline period. To assess possible climate impacts, projections of future conditions are compared to recent or past conditions. For this purpose, it has to be defined what ‘recent’ or ‘past’ means in terms of the considered time span. The impact variable of interest (e.g. river discharge) is then averaged across this reference period and all future values are compared to this average. There are recommendations of the World Meteorological Organization (WMO) to use the 30-year period 1961 – 1990 as the reference period to assess future changes. Beyond that, a regularly updated 30-years baseline period is recommended, currently 1981 – 2010, to compare the future period to the current climate. This gives people more recent context for measuring weather and climate extremes and forecasts. The Intergovernmental Panel on Climate Change (IPCC) used a shorter 20-year period 1986 – 2005 as the baseline in most graphs in the Fifth Assessment Report.
Investigating further
So let’s compare how future average discharge compares to historical average discharge using reference periods of 20 and 30 years in several basins. Therefore, we obtain average annual river discharge in eight river basins (Figure 1) across various climate regions using a calibrated regional hydrological model. We do so for the historical period (1960-2005) and for future climate (2006-2100) under a low greenhouse gas concentration scenario (RCP2.6) and the high greenhouse gas concentration scenario (RCP8.5).
The eight river basins used in this study and their climate regions
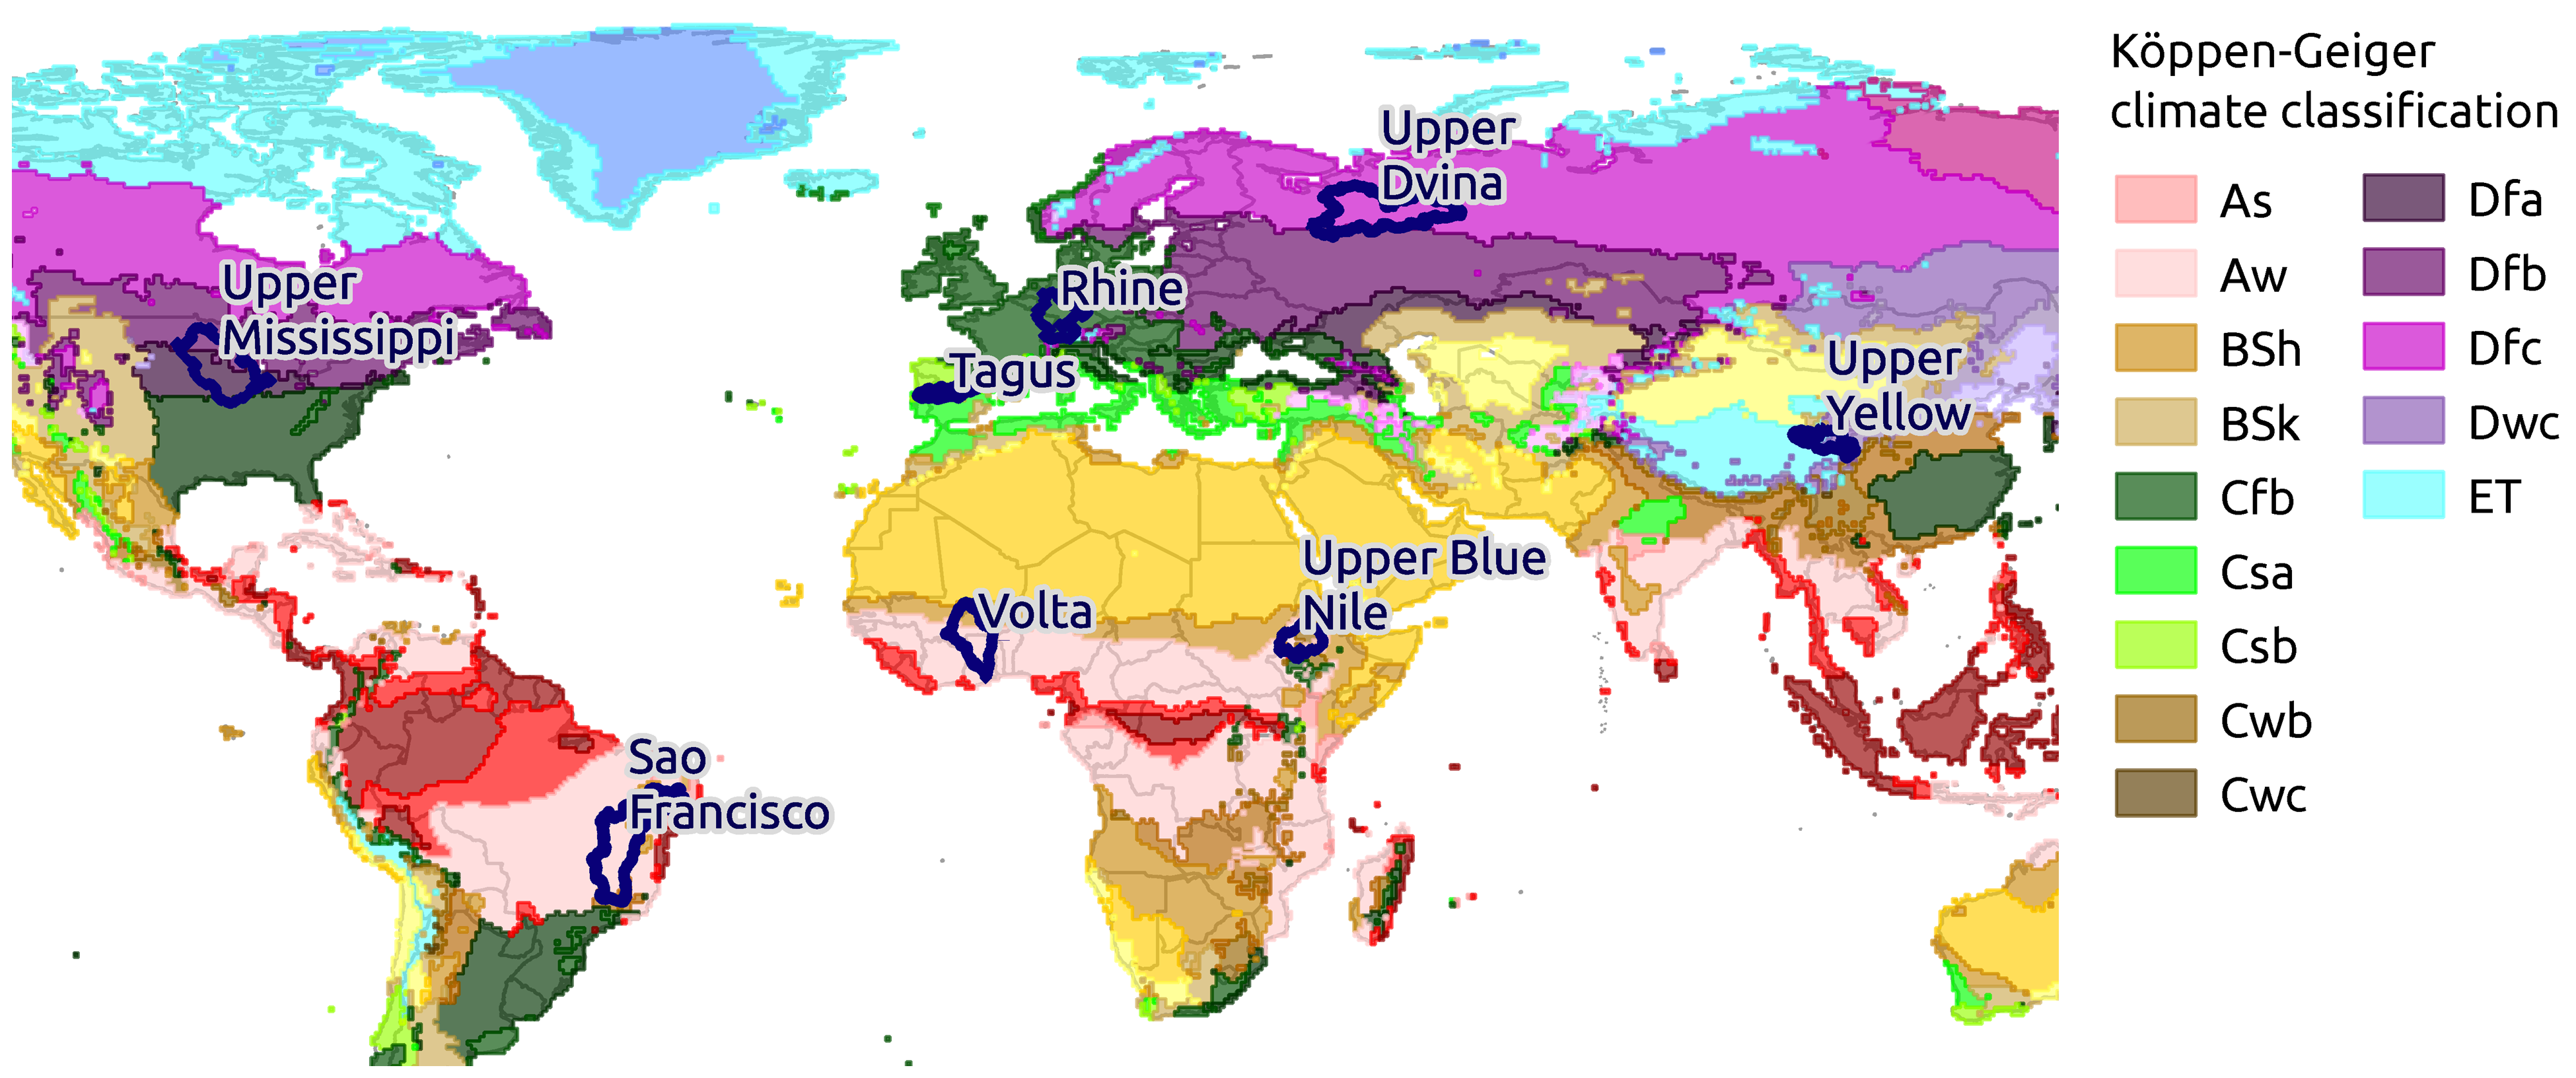
FIG 1 / Source: Liersch et al. (2020)
What did we find?
Figure 2 represents the change of future projections of river discharge in 8 river basins relative to average discharge in the two baseline periods. The first example shown is the simulated discharge in the Volta River basin. The climate during the WMO baseline period in the Volta River basin is rather wet with an average discharge of 1454 m3/s. In contrast, the climate during the IPCC baseline is relatively dry with an average discharge of 1115 m3/s. Future discharge is therefore compared with a wet and a dry period, creating a significant difference in an analysis of the distribution of wet, dry, and extreme years. On a global scale, these climate anomalies are likely to cancel out. However, on a regional scale using different baseline periods can lead to significantly different take-away results, which can then lead to different decisions that will be made by stakeholders that are responsible for regional water management.
Check by yourself how moving the baseline period (orange box) changes the take-away result for stakeholders. Also use the buttons to see the typical baseline periods used by the WMO (1961 – 1990) and IPCC (1986 – 2005). You may also move the projection period (black box).
Baseline period: raw data to final numbers
Baseline Period: impacts Baseline and Projected Discharge Anomaly.
Use the mouse to move and resize Baseline and Projection windows independently from each other.
Stakeholder take-away result for : Projected Discharge in will be % ( than usual) compared to the period between and . The projection result is an average calculated over years, for the climate scenario and the climate model .

FIG 2 / Adapted from Liersch et al. (2020).
Implications for climate researchers and stakeholders
So, what is the climate impact researcher supposed to do in cases where it apparently matters substantially which baseline period is chosen? First, the researcher should be clear what the implications are when using a specific baseline period and communicate it properly. Second, the researcher could use an alternative baseline period, which is flexible in its length and starting year and represents the basic statistics of a given historical period for each individual model.
Acknowledgements
This article was written in collaboration with the Editorial team of ISIpedia project.
Cover image: Adapted from Liersch et al. (2020)
Affiliations
1 Potsdam Institute for Climate Impact Research (PIK), Member of the Leibniz Association, P.O. Box 60 12 03, D-14412 Potsdam, Germany
2 Technical University of Denmark (DTU), Produktionstorvet, 2800 Kongens Lyngby, Denmark
3 WASCAL Competence Center, Blvd Moammar El-Khadafi, 06BP 9507, Ouagadougou 06, Ouagadougou, Burkina Faso
4 Global Climate Observing System (GCOS) Secretariat, c/o World Meteorological Organization (WMO)
5 Vrije Universiteit Brussel (VUB), Department of Hydrology and Hydraulic Engineering, Brussels, Belgium
6 The Norwegian Water Resources and Energy Directorate (NVE), PO Box 5091, Majorstua, 0301 Oslo, Norway