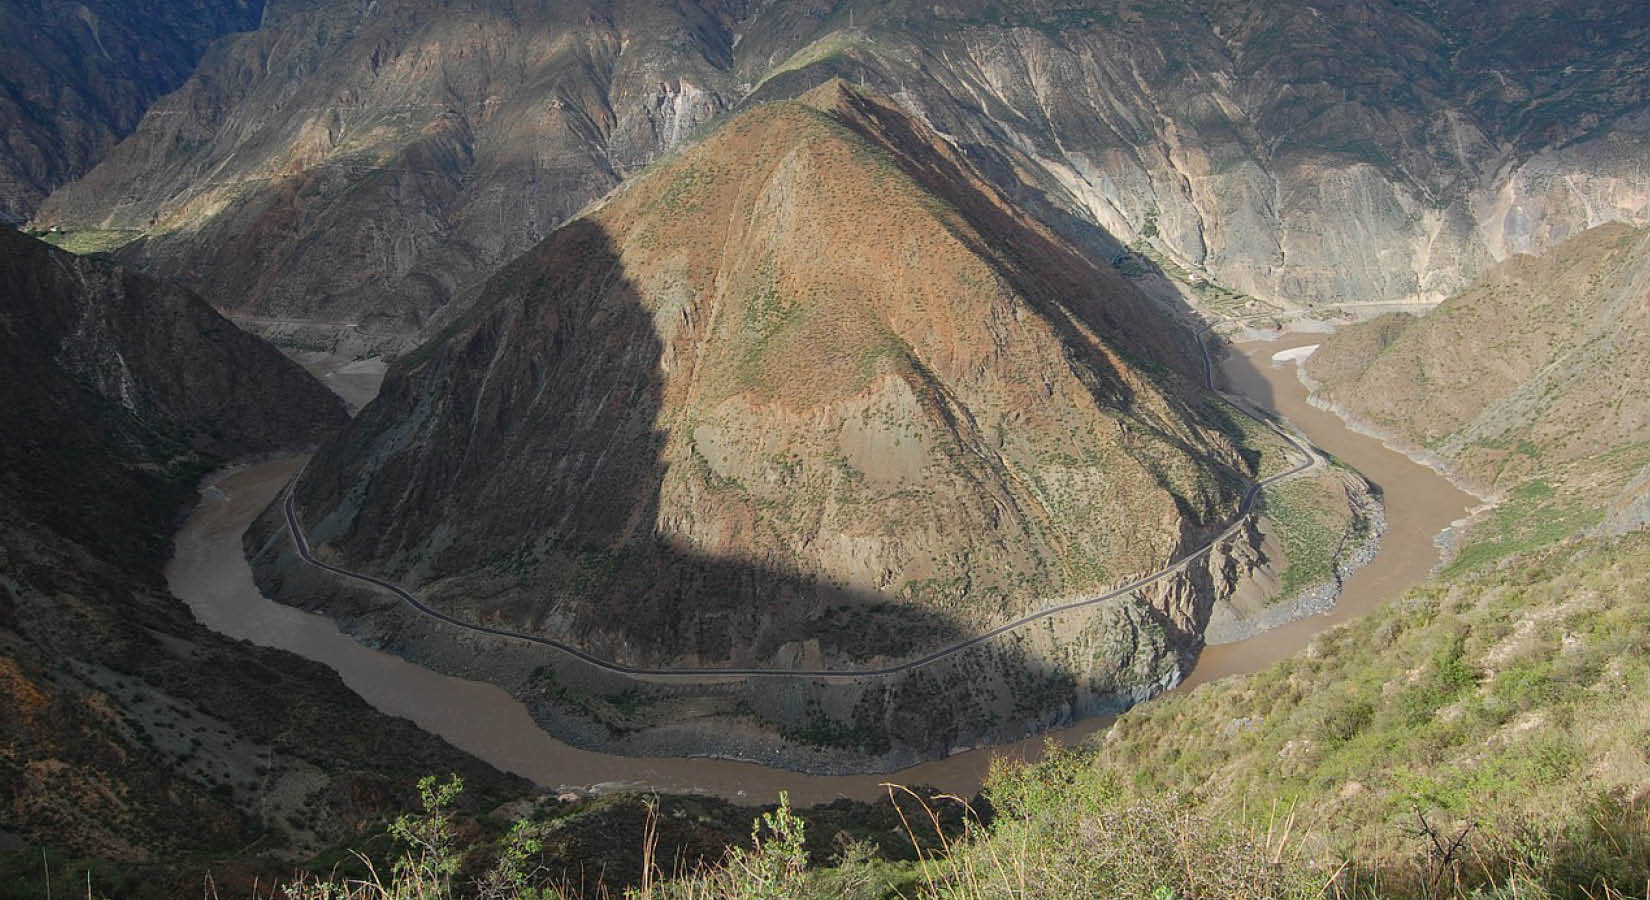
Water is a fundamental resource for live on earth. Humans require water for drinking and sanitation, growing crops, and industrial processes, while the environment requires water to flourish. China has experienced rapid economic development and a historically large population growth. This continuously increases water demand across the board, while climate change has started to affect precipitation patterns and reduced the size of the country’s glaciers. Moreover, the country’s water is unevenly distributed across regions. While the south of the country generally receives a lot of rain, water availability is much lower in other regions. Severe water scarcity is projected in many areas of China, which may cause environmental, economic and other societal issues. The South–North Water Transfer Project (南水北调工程)], a large infrastructural projects to transfer water across regions in China, has been used to alleviate water shortage in North China. Nevertheless, China would be facing large challenges as the intensified water stress would extend to the south under future climate change.
Quantifying water stress
To better deal with water stress, we may try to quantify water stress using a water stress index. Here, we employ the ratio of water withdrawal (including domestic water demand, electricity consumption, livestock, mining, and manufacturing) to water availability. This means that high water withdrawal with low water availability indicates a high-water stress index. When the water stress index is higher than 0.4, i.e., water withdrawal accounts for more than 40% of available water, the area is considered to be under severe water stress. If the withdrawal is larger than available water (i.e., water stress index is higher than 1), this means that a part of water use is either coming from nonrenewable sources (e.g., groundwater that is not replenished) or is diverted from somewhere else. Environmental flow requirements are subtracted from water availability to ensure the sustainability of river ecosystems.
We calculated the water stress index for both historical and future periods. We obtained monthly natural streamflow and runoff from six global hydrological models provided by the ISIMIP2a (Gosling et al. 2017) and water withdrawals from (Huang et al. 2018) for the historical period. Reported water withdrawals and water resources at the basin level were also obtained from the China Water Resources Bulletin from the Ministry of Water Resources of China for validation of the model results. Future water stress index was calculated based on the future water availability and water withdrawals from the ISIMIP2b dataset. Both the water availability and water withdrawals were estimated using the H08 (Hanasaki et al. 2018) and the PCR-GLOBWB (Wada et al. 2016) models with climate projections for a low-emission scenario (RCP2.6) and a high-emission and stabilization scenario (RCP6.0).
What did we find?
In short, water stress was mostly found in northern China in the past but will increase in most of China in the near future. More than 50% of total land area and 600 million population of China will face severe water scarcity by 2050.
A changing equation
In general, we find that water withdrawals increase by more than 50% across China by 2050 compared to the historical period. This is largely driven by China’s rapid economic development as population growth is levelling off and projected to start decreasing around 2030.
Future projections of water availability show distinct patterns between the north and south of China. Historically, the north has been under severe water stress largely due to limited rainfall. However, water availability is expected to increase slightly in the future. On the other hand, water availability is expected to decrease in the water-rich south due to climate change.
Water stress across China
We compared the historic simulated water stress with reported data (2001-2010) from the China Water Resources Bulletin for 10 major river basins in China. We found that the simulated data is generally consistent with observed data. So let’s explore the simulated results in detail.
Water stress index: past and future
Map shown for the period

FIG 1 / Adapted from X. Liu et al. (2019).
Figure 1 shows the water stress index for China for the past (1971-2010) and the future (2021-2050). Figure 2 shows the population under severe water stress. For future scenarios, both a low emission scenario (RCP2.6) and a high emission scenario (RCP6.0) are shown.
Number of people projected under water stress by 2050
The data is projected for the years 2021-2050, according to the projection scenario RCP 6.0
FIG 2 / Adapted from X. Liu et al. (2019).
In total, water stress is expected to increase in more than 70% of the total land area, and by more than 50% in around 12% of the land area for both RCPs. By 2050, nearly 50% of China’s land area and more than 600 million people might be under severe water stress. Both the patterns and severity of the projections are similar for RCP2.6 and RCP6.0. Water stress is projected to be experienced on average in 31% of China’s land area for RCP2.6 and 32% for RCP6.0. We find that northern basins are projected to show a decrease in water stress, while the southern basins are projected to face an increase in water stress. Relative changes of more than 100% are expected in the middle reaches of the Yangtze River and some parts of the Pearl River, Northwest Rivers, and the Songhua River.
Several solutions were proposed to mitigate these issues, such as improved reservoir management, reallocation of water through water transfers and increased water use efficiency. When implementing these solutions, climate change and socioeconomic development need to be considered while also considering up- and downstream connections between water availability and water demand. Nevertheless, the integration of solutions to deal with severe water stress would remain a great challenge in some regions.
What’s next?
Some shortcomings in this study are also identified. For example, we only consider water quantity while water quality is also an important factor. Especially when water quantities become lower, water quality can drop quickly as the pollution remains in the water while clean water evaporates. For example, water stress was historically rarely found in the south of China when only water quantity was considered, but it did appear due to poor water quality (J. Liu et al. 2017). When water is of poor quality, it can become unsuitable for certain applications or require extensive treatment before usage, thus leading to another form of water stress.
Moreover, we should more carefully consider the dynamics of water availability throughout the year. This is especially important in countries that experience a wet season like China, leading to a large underestimation of water stress during the dry season.
In addition, the hydrological models used do not consider several adaptations such as water transfer between basins, rainwater harvesting and the desalinization of seawater. Especially the large water transfers in China through the South-North Water Transfer project become increasingly important as the project develops. This leads to an overestimation of water stress in the target basins, while water stress in the source basin is underestimated.
The approach to estimate environmental flow requirements is also relatively simple. It is assumed that the water requirements of ecosystems are a minimum based on historic streamflow. In reality, different ecosystems might require a different quantity and quality of water.
Acknowledgements
This ISIpedia article was written in collaboration with the Editorial team of ISIpedia project.
Contact
Please contact the ISIpedia editorial team (isipedia.editorial.team@pik-potsdam.de) for more information or questions about this report.
References
Affiliations
1 Key Laboratory of Water Cycle and Related Land Surface Processes, Institute of Geographic Sciences and Natural Resources Research, Chinese Academy of Sciences, Beijing, China
2 Eawag, Swiss Federal Institute of Aquatic Science and Technology, Duebendorf, Switzerland
3 College of Resources and Environment, University of Chinese Academy of Sciences, Beijing, China
4 Laboratoire des Sciences du Climat et de l'Environnement, LSCE/IPSL, CEA-CNRS-UVSQ, Université Paris-Saclay, Gif-sur-Yvette, France
5 Institute for Environmental Studies (IVM), Vrije Universiteit Amsterdam, Amsterdam, Netherlands
6 International Institute for Applied Systems Analysis (IIASA), Laxenburg, Austria
7 National Institute for Environmental Studies, Tsukuba, Japan
8 School of Environmental Science and Engineering, Southern University of Science and Technology, Shenzhen, China
9 Department of Environmental Sciences, MGU, University of Basel, Basel, Switzerland